Portfolio Performance
In the new Investor Portal experience, Portfolio Performance gives investors detailed and cumulative reporting on distributions and contributions. The article below describes how to navigate to and fully utilize the Portfolio Performance section.
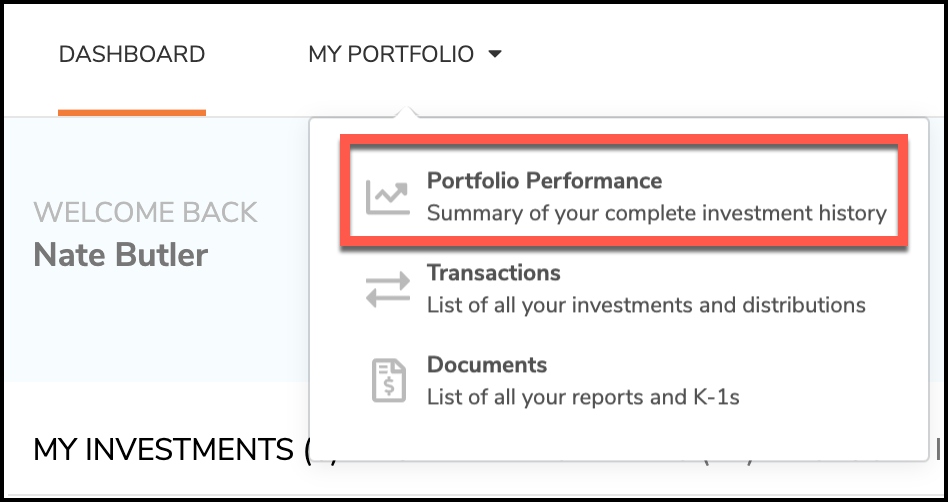
1. After logging into your portal, select the My Portfolio tab in the header menu. Next, select Portfolio Performance:
2. Portfolio Performance features a graph that shows cumulative distributions to date per quarter:
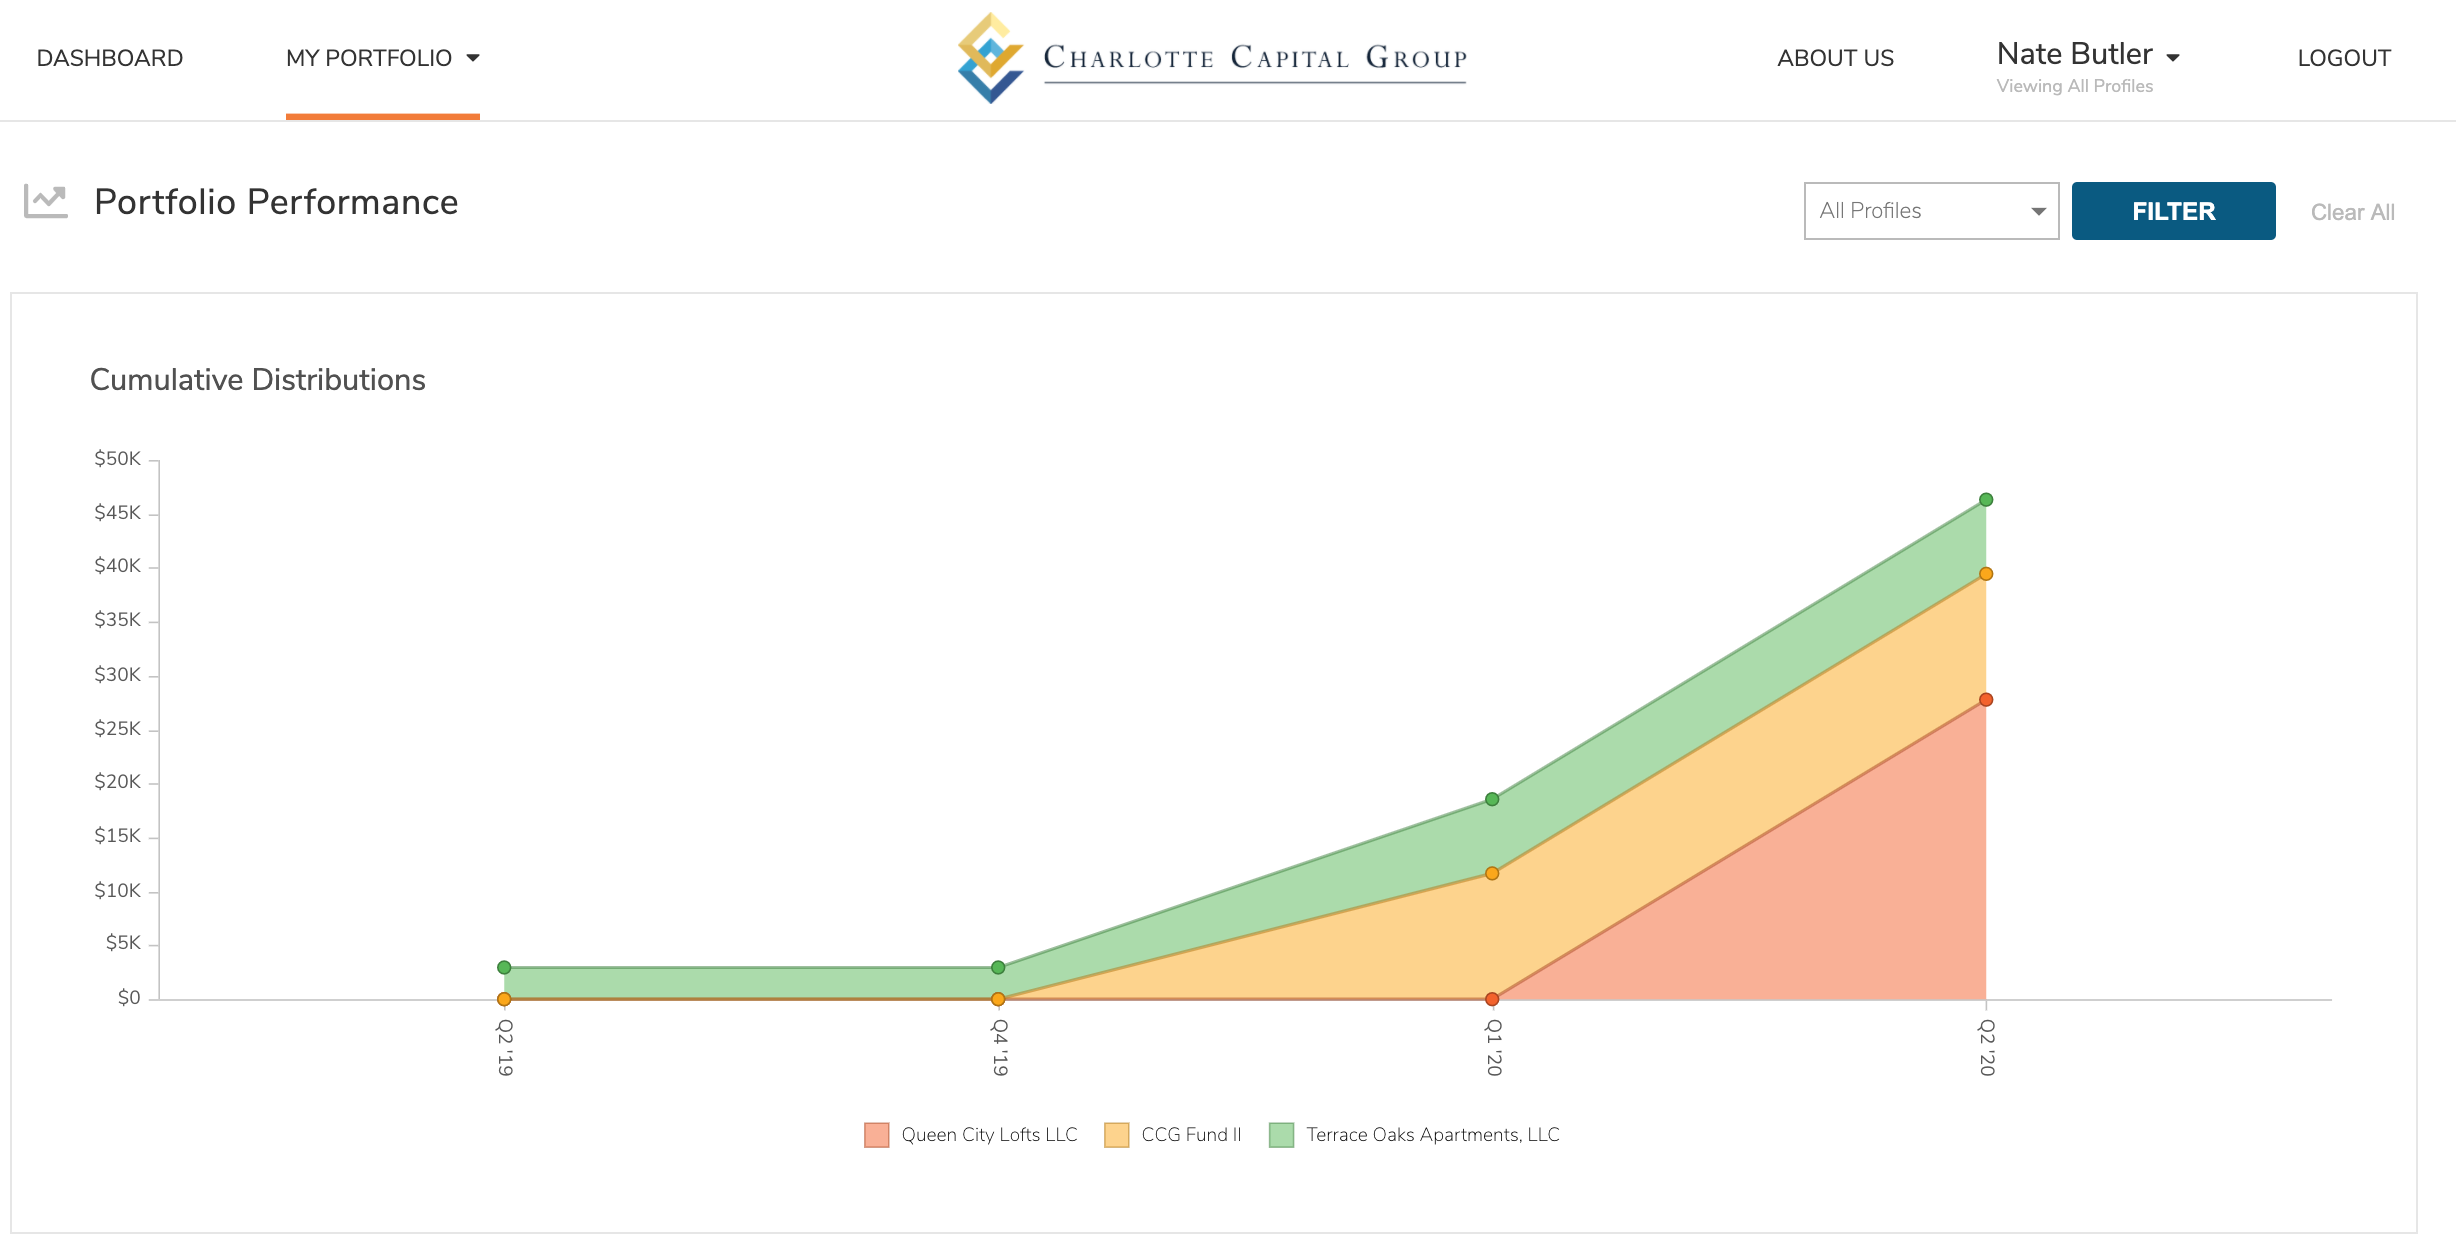
Hover over each dot on the graph to reveal the distribution amount or only view distributions for certain investments by changing the chart view. To only view a certain investment, toggle the colored icon next to the investment name:
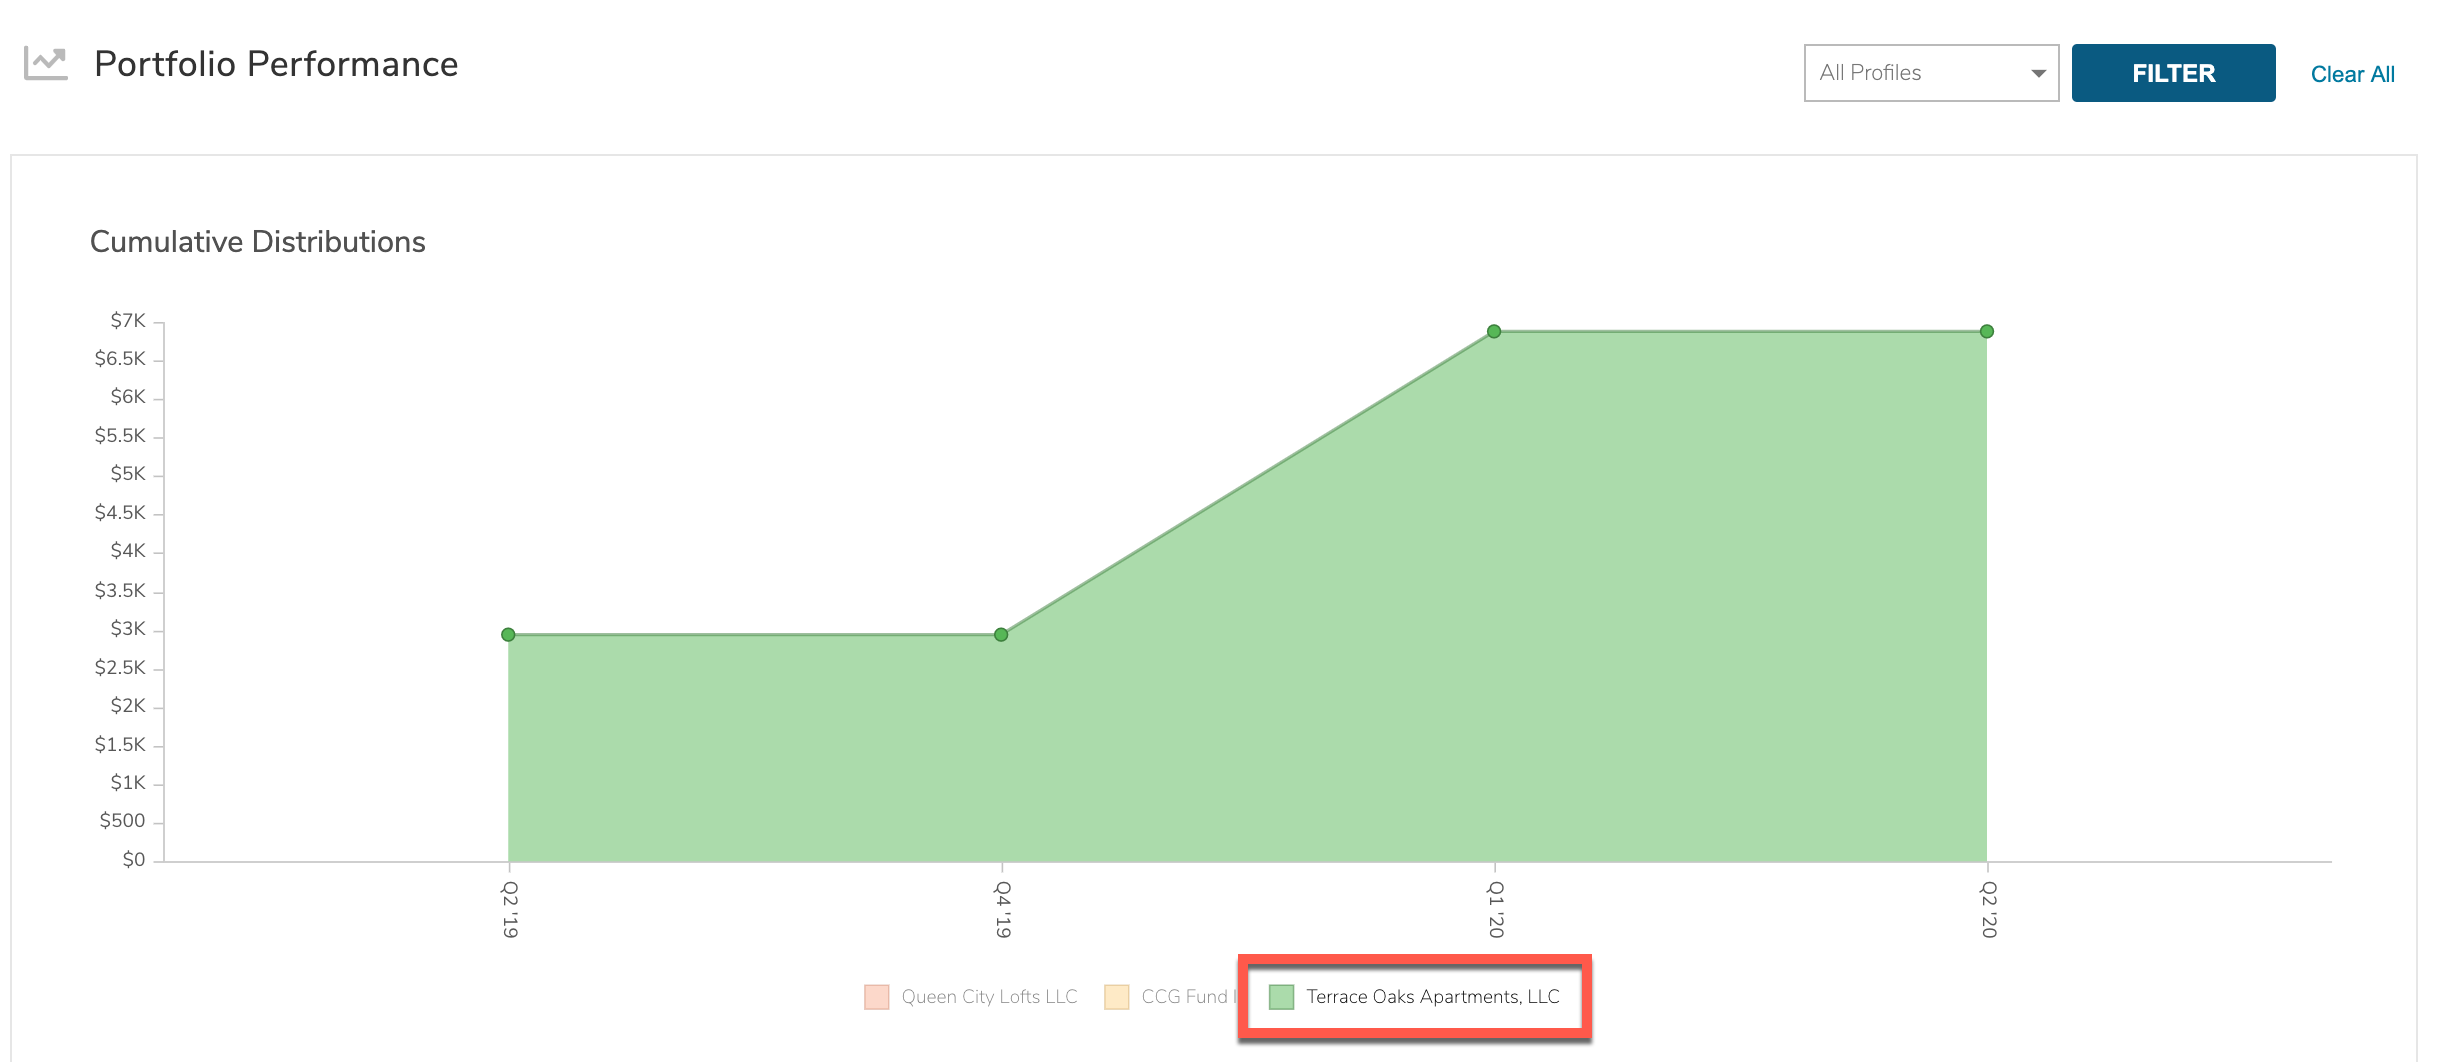
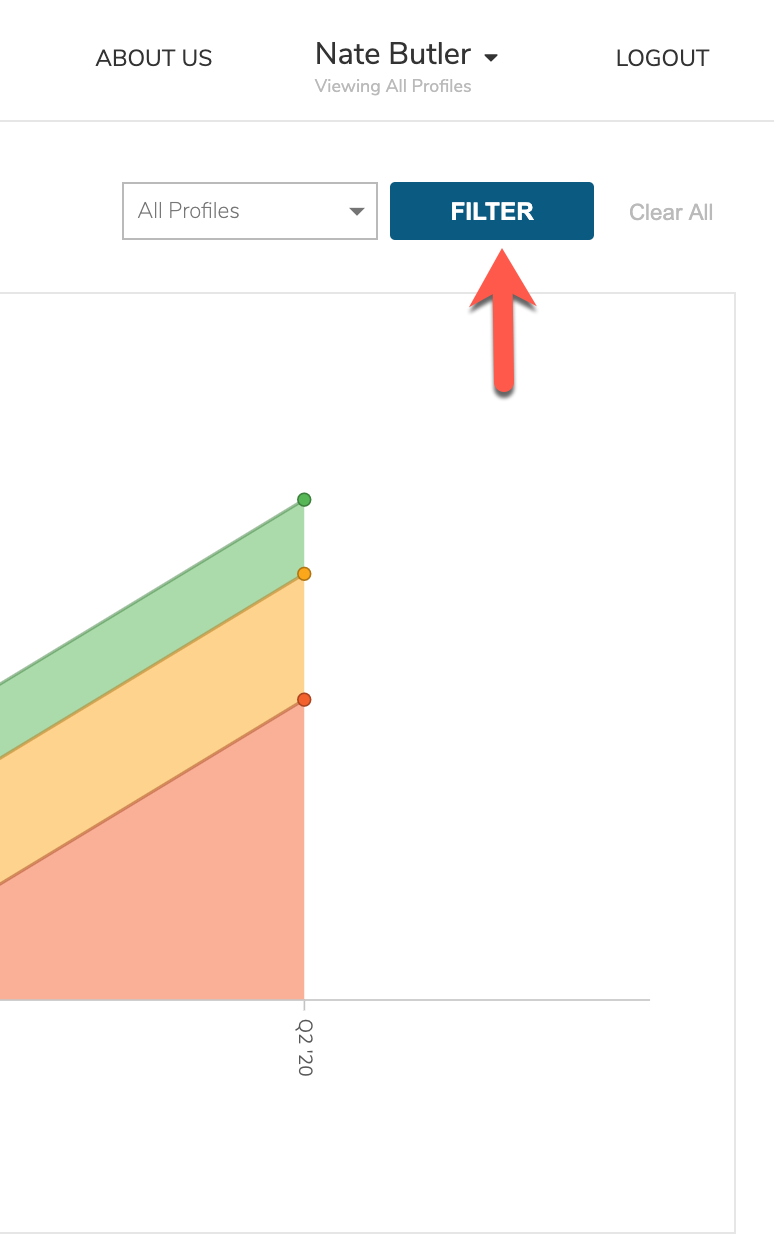
3. Filter by investment profiles to reveal distributions for a specific investment vehicle:
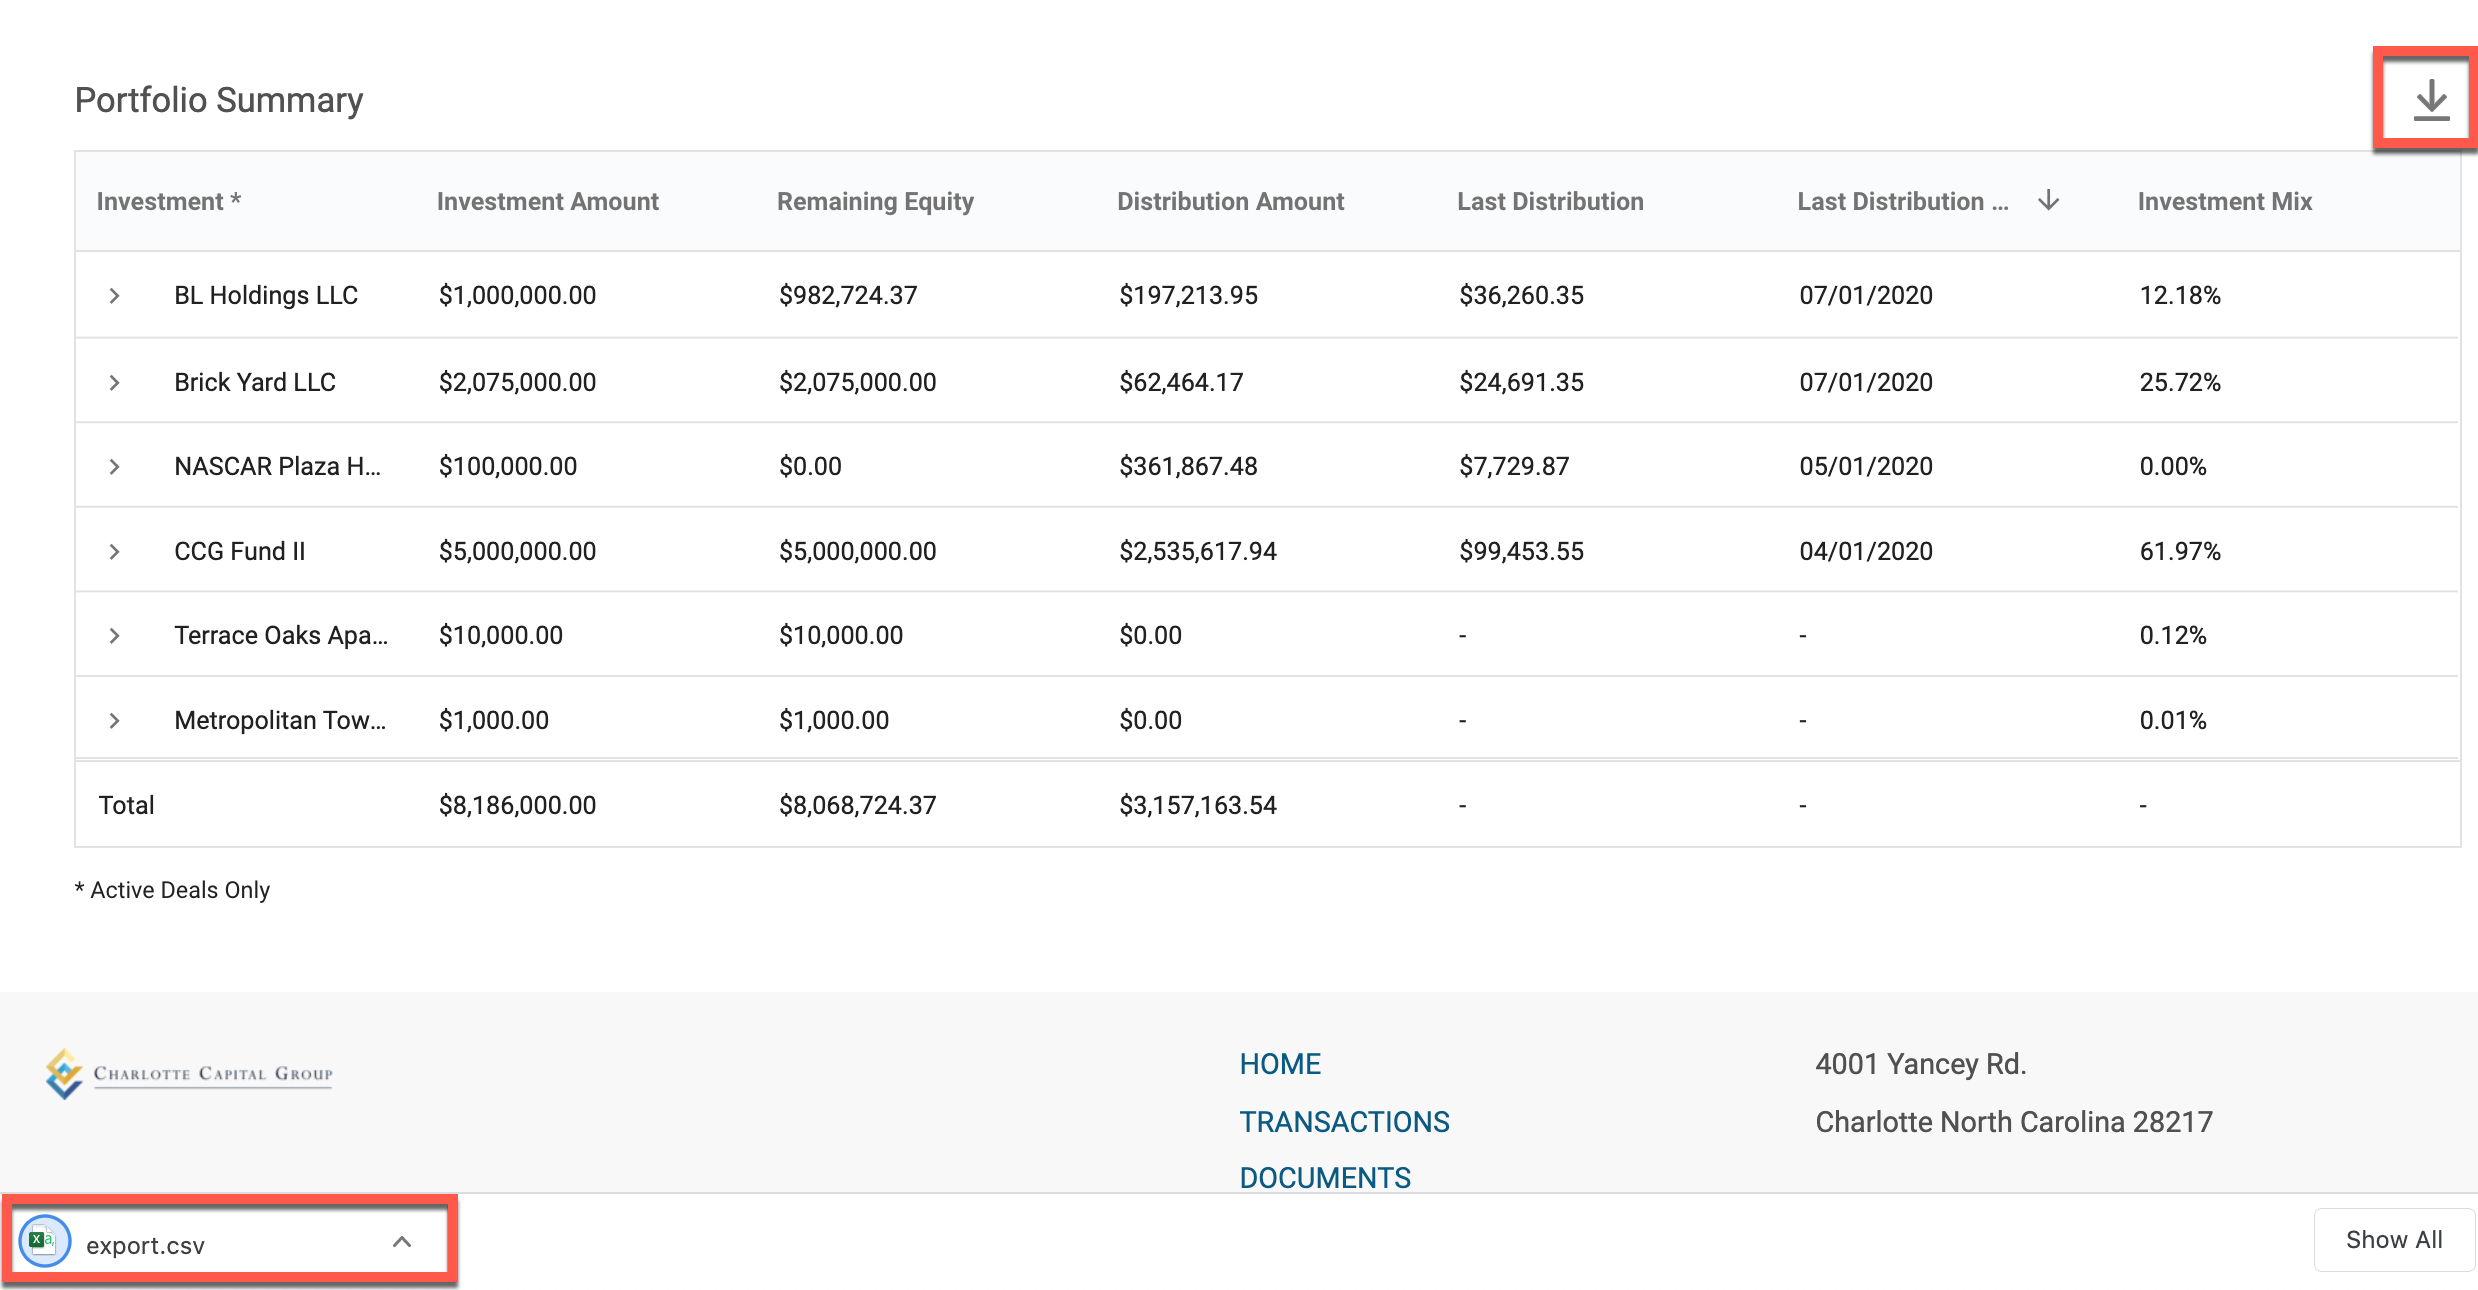
4. Scroll down the page to reveal the interactive chart which displays distribution and contribution details:
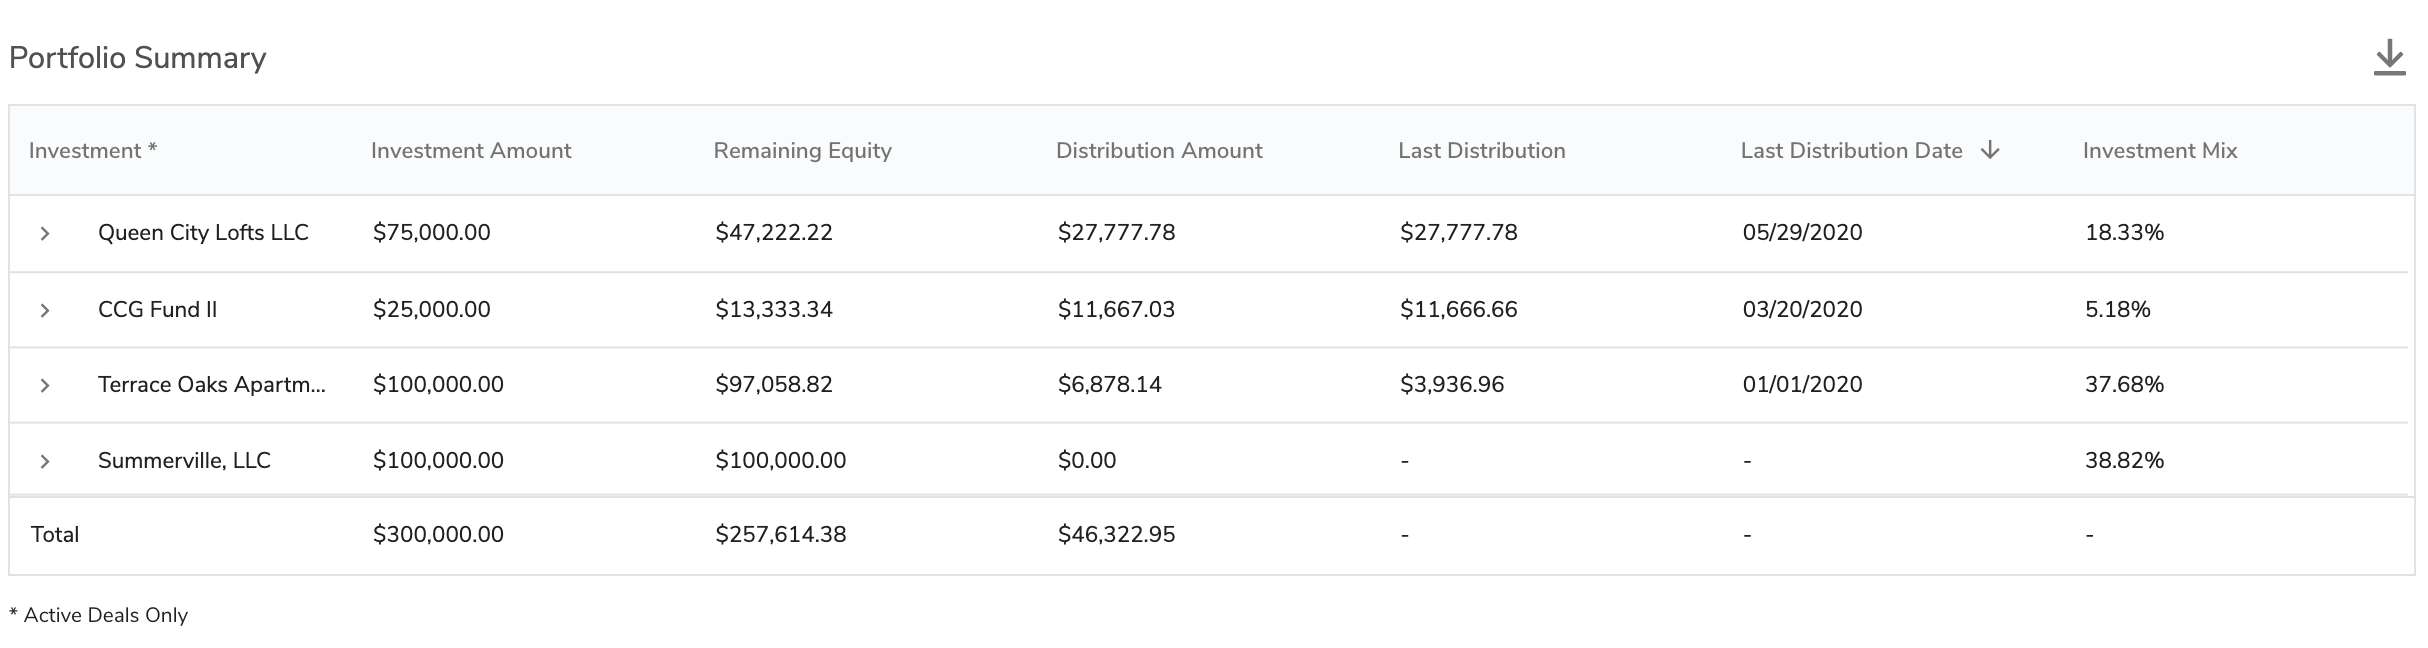
The chart can be expanded to show details for each investment by selecting the small arrow next to each investment name. The expanded view shows activity details on distribution type, amount, and date:
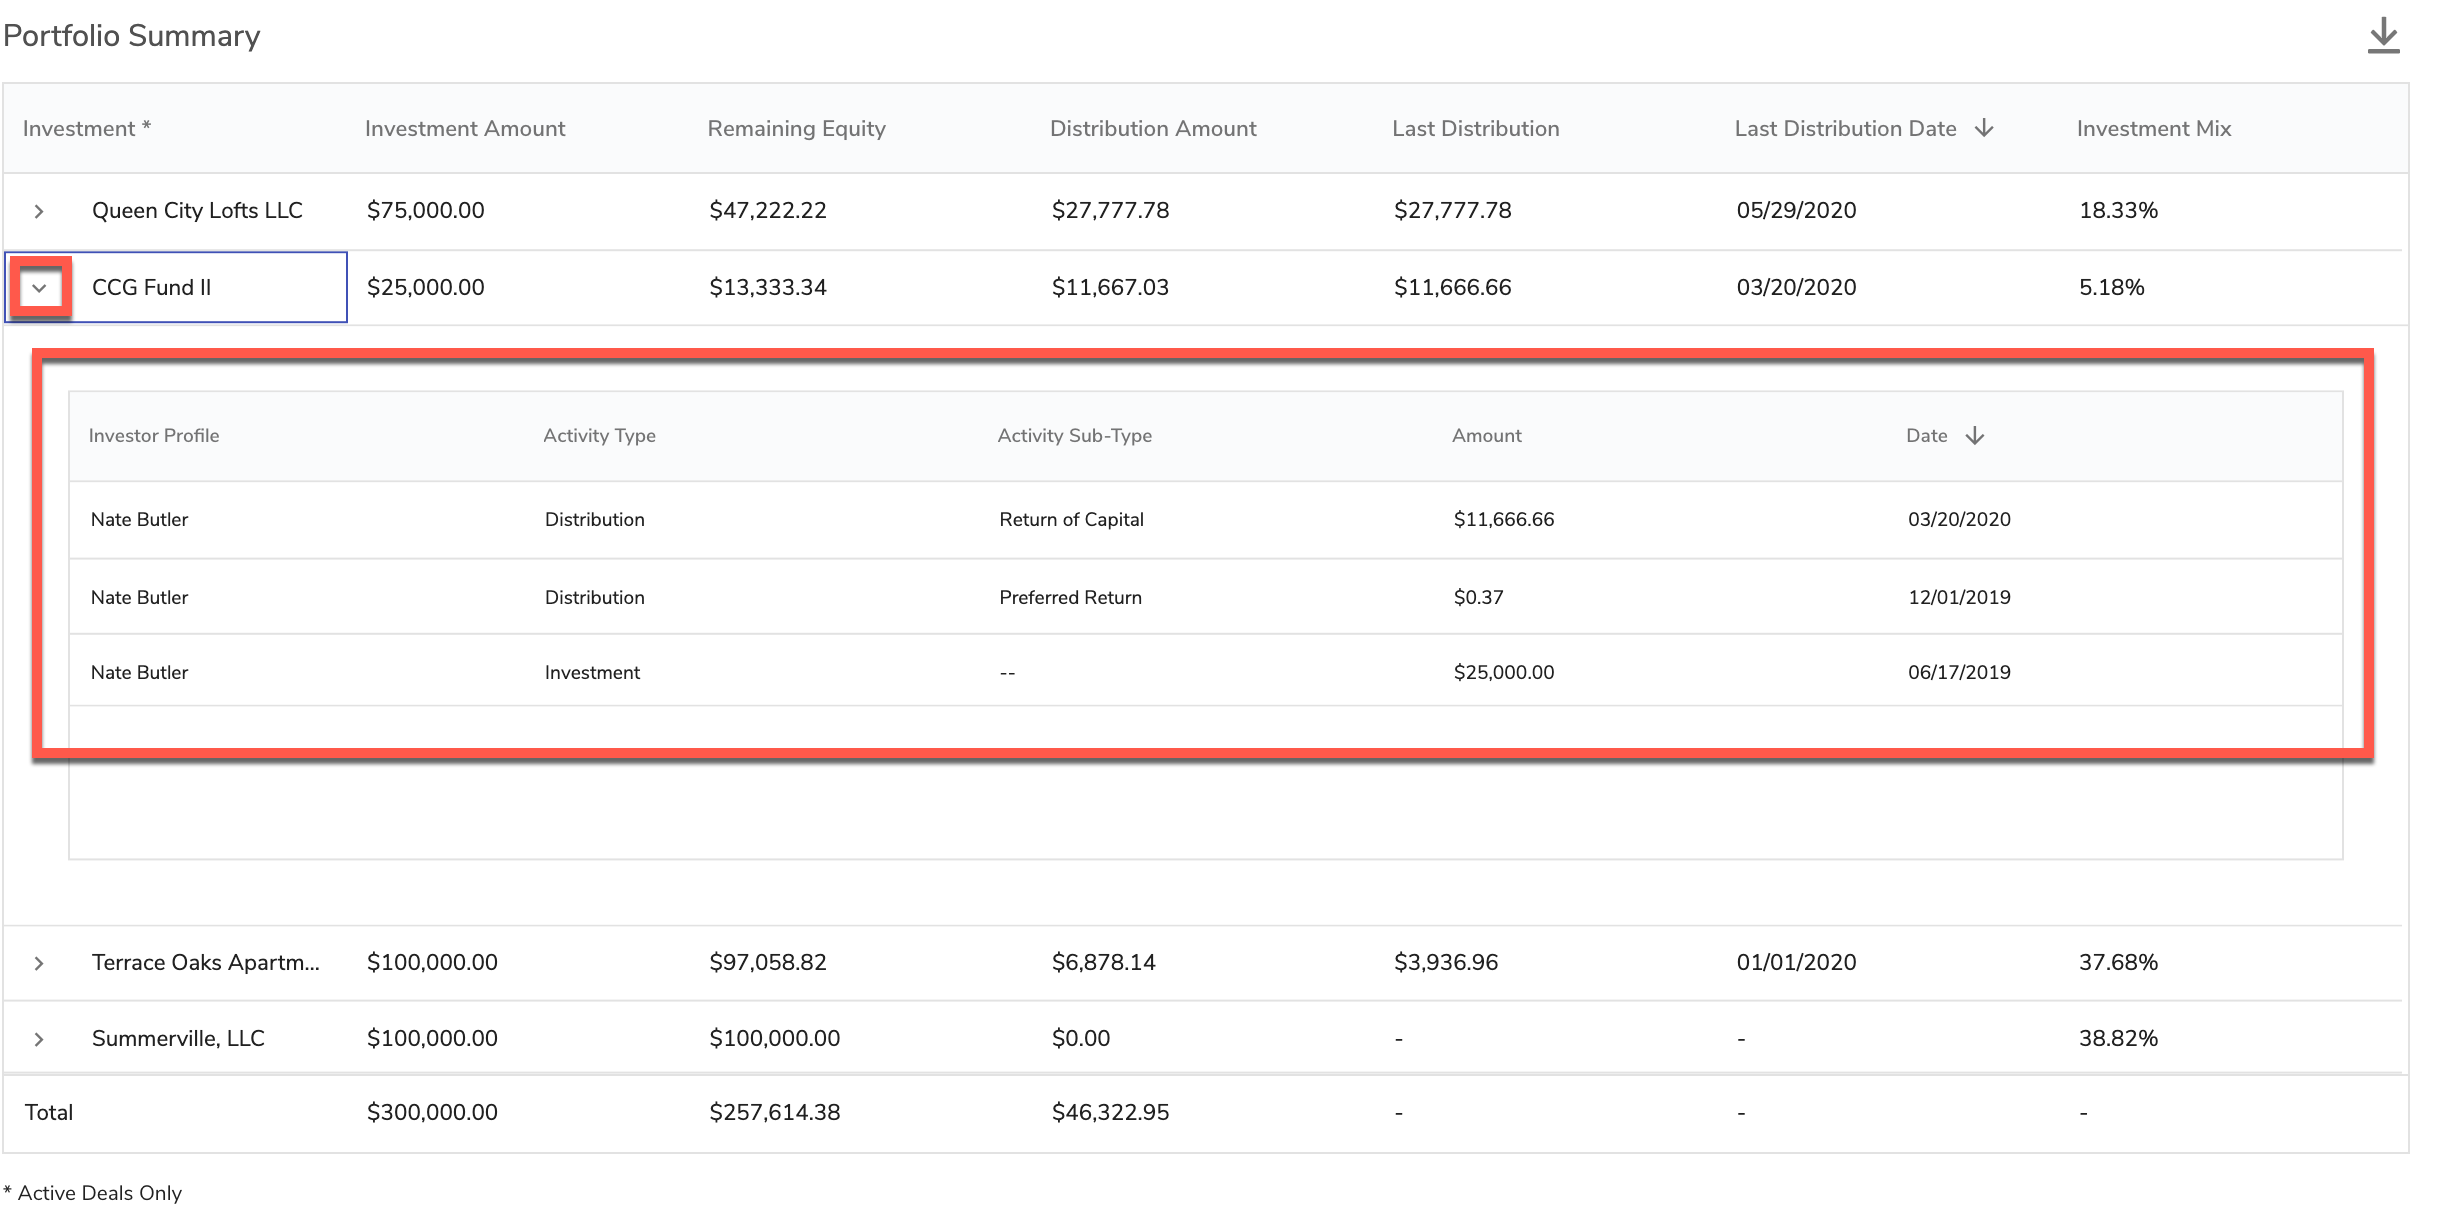
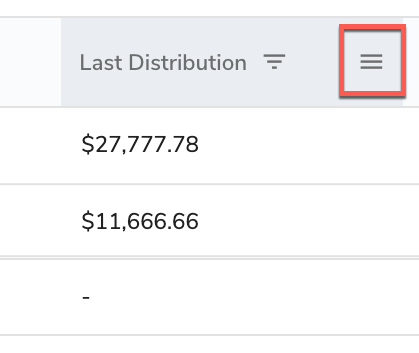
5. The columns on the chart can be sorted by ascending or descending by selecting the column name which will reveal an up or down arrow:
6. The columns can be further filtered and organized by selecting the menu next to each column name:
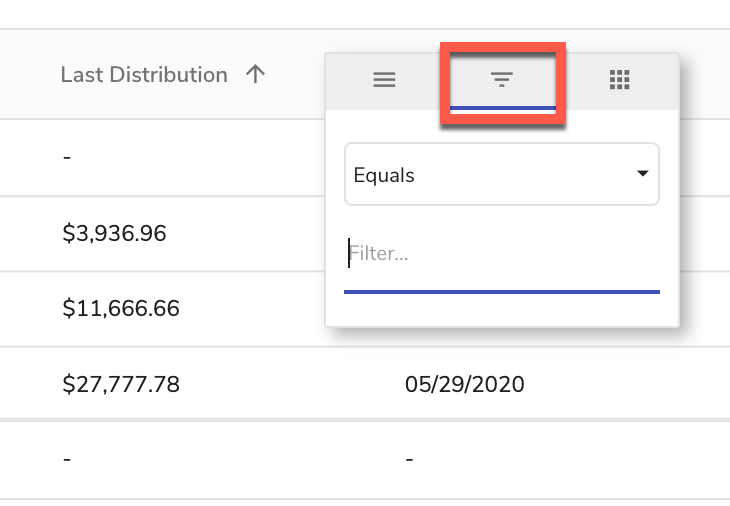
After selecting the menu icon, an additional menu will appear. To further filter the data, select the pyramid icon and choose the filter you'd like:
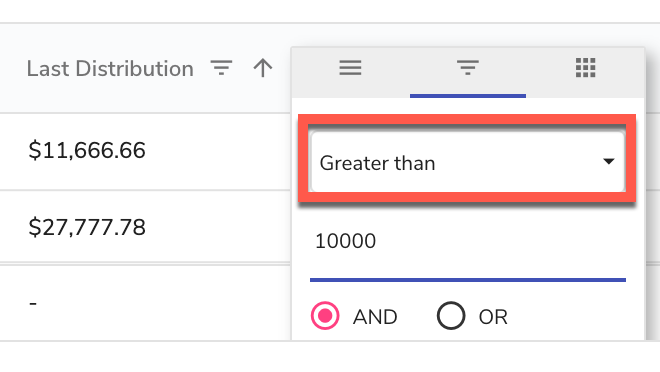
Example: A filter that only shows distributions greater than $10,000 has been chosen. After selecting this filter, now the Last Distribution column data will update to reflect.
7. Investors can download the report to an Excel file if they wish. Select the downward arrow on the Portfolio Summary chart. A download will automatically begin.